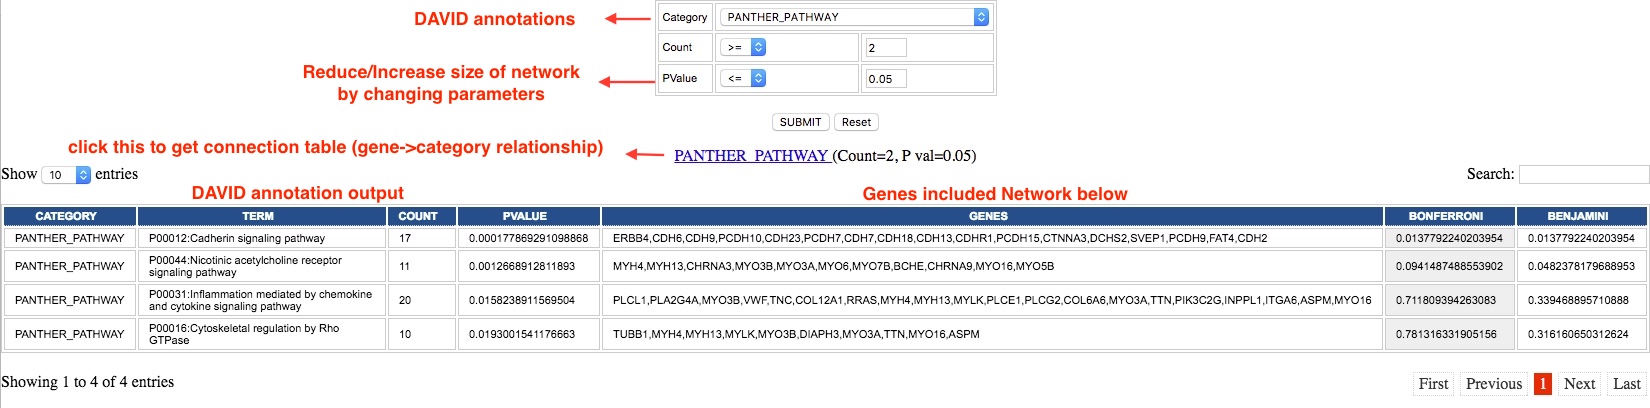
The result will only include available DAVID annotaiton categories available for a list of input genes.
Main output from Network Analyser includes:
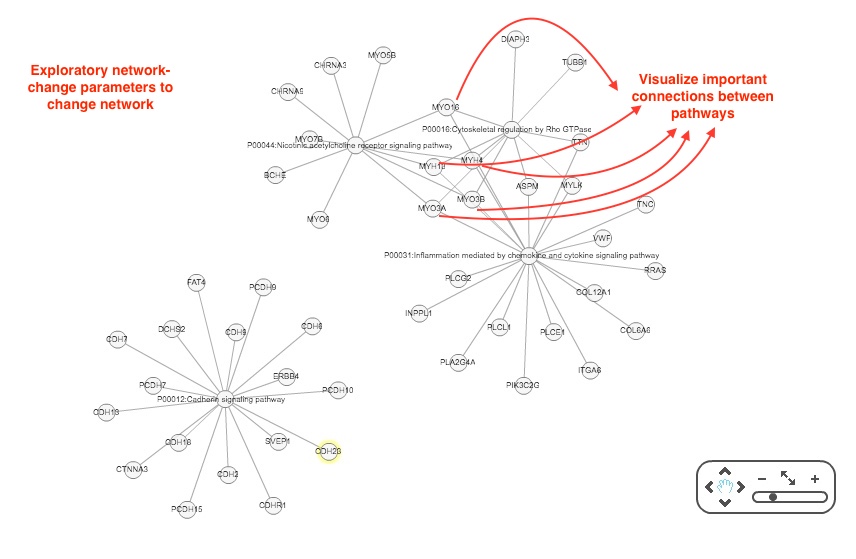
Network output: Visual output to reveal overlapping biological connections for a list of relevant genes. By default PANTHER_PATHWAY network is generated. A network output is generated only if there are significant annotation categories; if a network is not generated it means there are no significant outputs for the selected Category.
Network Connection table: This table gives details on the network contribution of each gene for each selected annotation category. Please note that this table will only be generated on clicking the SUBMIT button in th output page.
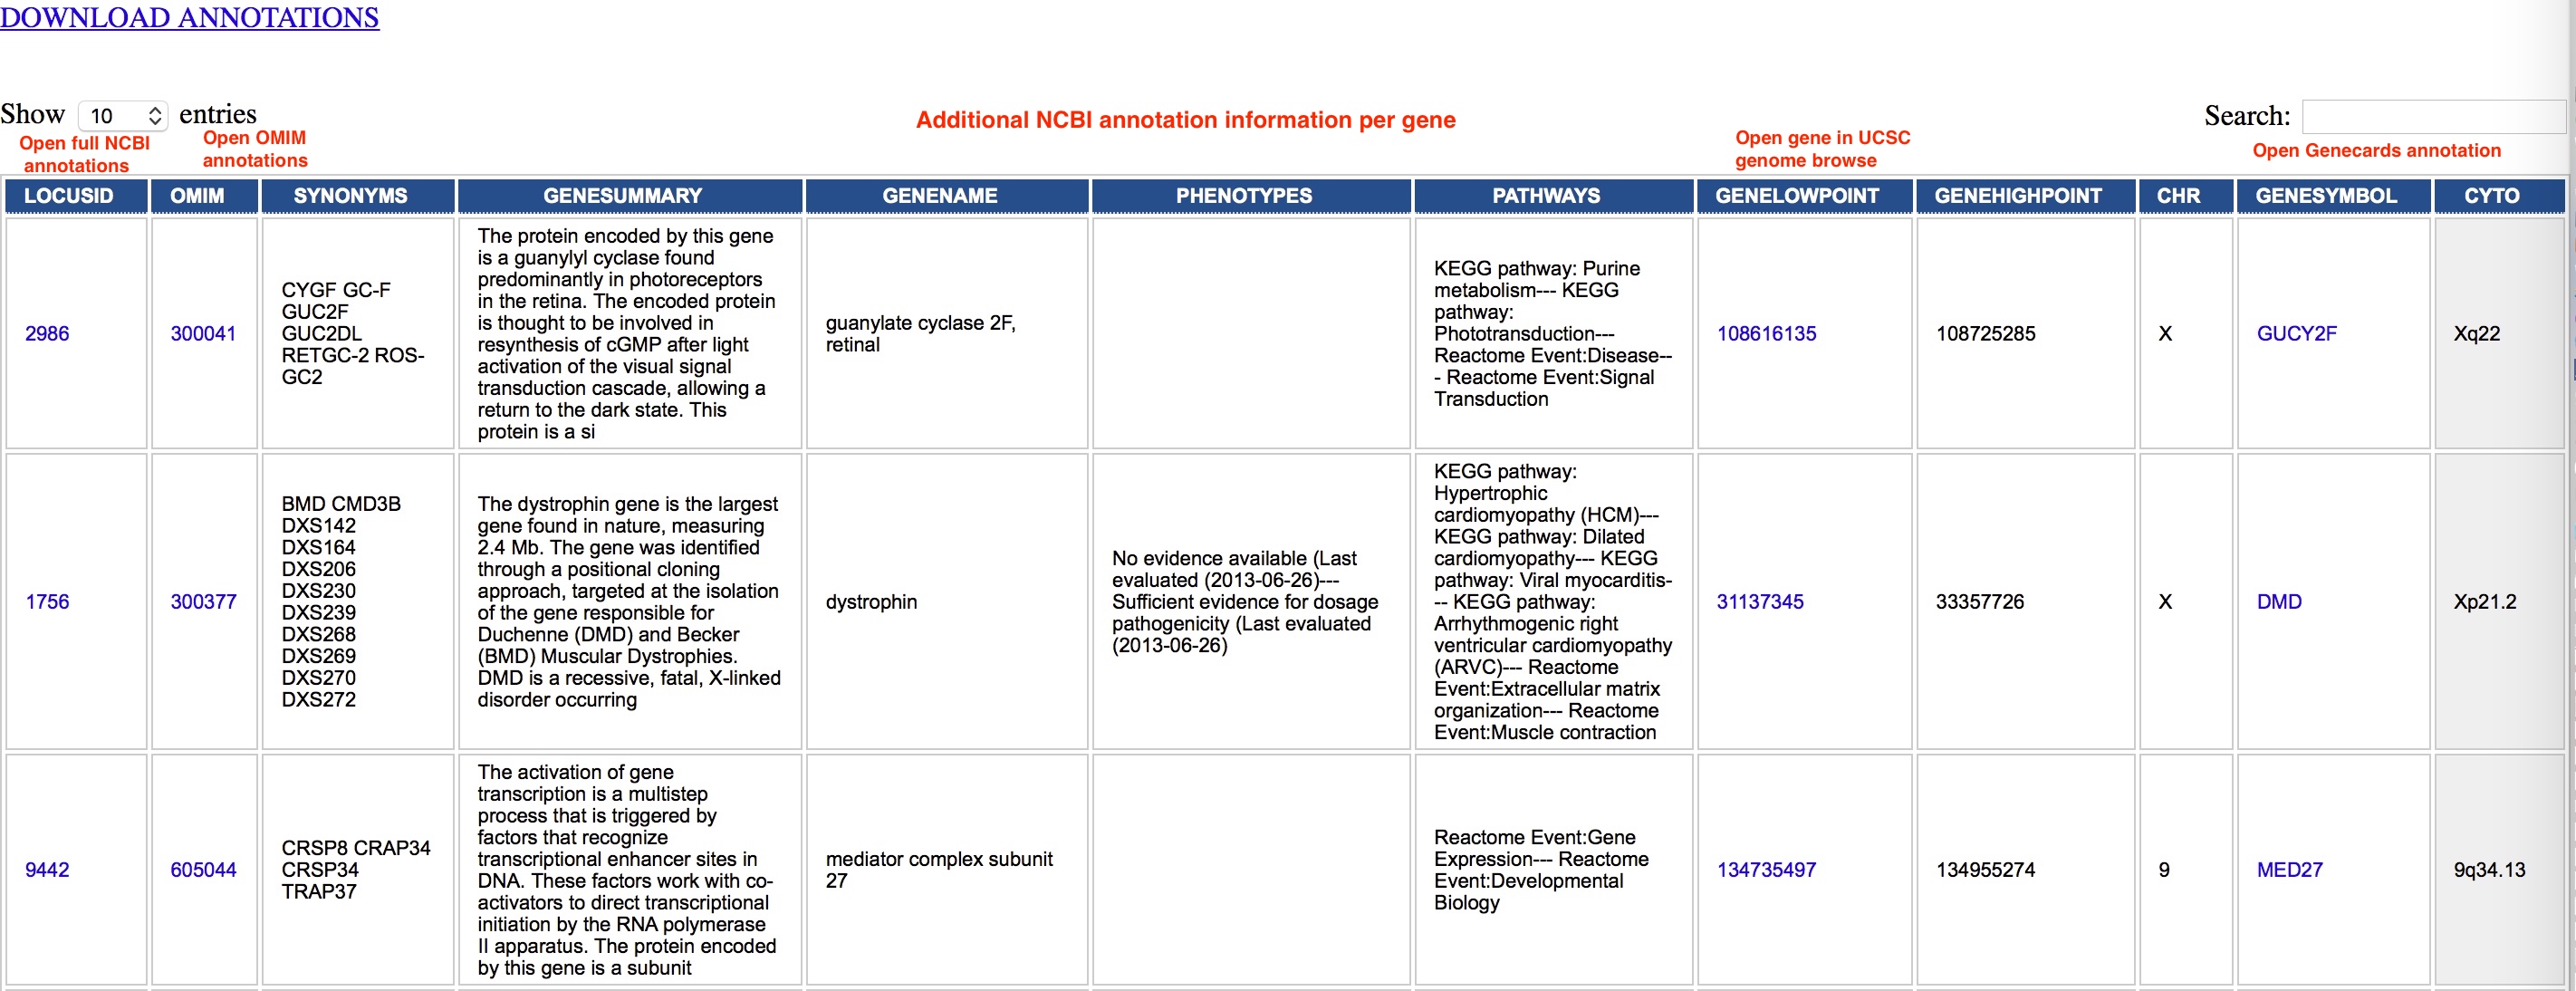
Gene Annotation table from NCBI: This will give annotations based on available gene information collated from NCBI.
Results can be downloaded by using the Righ click Save As option on the DOWNLOAD FULL RESULT link. The .txt result can then be easily opened using Excel.